
バンク・オブ・アメリカ
$60.95-0.32時価総額
$353.6B
世界順位
#36
過去最高値
$453.2B
2026-08-12
総成長率
+0%
2026年以降
Market Cap Context
- Larger than 90% of the 367 companies we track (globally).
- Equivalent to 1.1% of United States's GDP (2025 data).
- Just above: #35 メルク ($358.4B)
- Just below: #37 The Home Depot, Inc. ($319.1B)
- Best year: 2012 (+110%). Worst year: 2008 (-63%).
バンク・オブ・アメリカ Financial Breakdown (FY 2025)
Source: Yahoo Finance — BAC annual filings (2025) →$113B revenue · $0.0B operating income · $30.5B net income
- ●Net income margin: 27.0% — $30.5B in profit.
- ●Free cash flow: $12.6B (11.2% of revenue).
Cost / Operating Expenses
Total operating expenses $113B
Total
$52.2B
Free Cash Flow
$12.6B
Trailing twelve months
Figures rounded from the annual SEC filing. Unaudited. For informational purposes only, not investment advice.
Fundamentals (TTM)
Data: Financial Modeling PrepP/E
13.8
EPS
$4.71
Net margin
19.0%
ROE
11.1%
Dividend yield
1.84%
Debt / Equity
2.43
バンク・オブ・アメリカについて
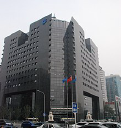
The Bank of America Corporation is an American multinational bank and financial services holding company headquartered at the Bank of America Corporate Center in Charlotte, North Carolina, with investment banking and auxiliary headquarters in Manhattan. The bank was formed by the merger of NationsBank and Bank of America in 1998. It is the second-largest banking institution in the United States and the second-largest bank in the world by market capitalization, both after JPMorgan Chase.
バンク・オブ・アメリカの時価総額推移 (2026–2026)
バンク・オブ・アメリカ vs Sector Peers by Market Cap
バンク・オブ・アメリカを比較




順位の推移
| 年 | 時価総額 | 順位 | 前年比 |
|---|---|---|---|
| 2026 | $353.6B | #36(↓10) | -8.0% |
| 2025 | $384.1B | #26(↑1) | +28.1% |
| 2024 | $299.9B | #27(↑11) | +33.1% |
| 2023 | $225.3B | #38(↓6) | +5.4% |
| 2022 | $213.7B | #32(↓6) | -23.9% |
| 2021 | $280.8B | #26(↑5) | +49.8% |
| 2020 | $187.4B | #31(↓7) | -11.7% |
| 2019 | $212.2B | #24(↑2) | +46.2% |
| 2018 | $145.2B | #26(↓6) | -15.5% |
| 2017 | $171.7B | #20(↑2) | +35.7% |
| 2016 | $126.6B | #22(↑9) | +33.7% |
| 2015 | $94.6B | #31(↓3) | -4.8% |
| 2014 | $99.4B | #28(↑2) | +15.5% |
| 2013 | $86.1B | #30(↑3) | +34.6% |
| 2012 | $64.0B | #33(↑29) | +109.6% |
| 2011 | $30.5B | #62(↓41) | -58.1% |
| 2010 | $72.8B | #21(↓9) | -11.2% |
| 2009 | $81.9B | #12(↓4) | +9.9% |
| 2008 | $74.6B | #8(↓7) | -63.4% |
| 2007 | $203.8B | #1 | -20.0% |
| 2006 | $254.7B | #1 | +20.7% |
| 2005 | $211.0B | #1 | +3.4% |
| 2004 | $204.0B | #1 | +21.6% |
| 2003 | $167.8B | #1 | +20.0% |
| 2002 | $139.8B | #1(↑1) | +14.6% |
| 2001 | $122.0B | #2(↑8) | +41.3% |
| 2000 | $86.3B | #10(↓3) | -3.7% |
| 1999 | $89.6B | #7(↓5) | -14.1% |
| 1998 | $104.4B | #2(↓1) | +1.2% |
| 1997 | $103.1B | #1 | +27.3% |
| 1996 | $81.0B | #1 | +43.5% |
| 1995 | $56.5B | #1 | +59.8% |
| 1994 | $35.3B | #1 |
その他の金融サービス企業





よくある質問
What is Bank of America Corporation's market cap?
Bank of America Corporation (BAC) has a market capitalization of $353.6B, making it the #36 largest company in the world by market cap.
What was Bank of America Corporation's highest market cap?
Bank of America Corporation's all-time high market cap was $453.2B, reached in 2026-08-12. Its highest rank was #26 in 2025.
What sector is Bank of America Corporation in?
Bank of America Corporation is in the Financial Services sector, specifically the Banks - Diversified industry. It is based in United States.
How has Bank of America Corporation's market cap changed over time?
Bank of America Corporation has been tracked since 2026. Its market cap has grown by 0% from $353.6B in 2026 to $353.6B today.